
+1
Under review
Analog Log - problem when Input Value doesn't change
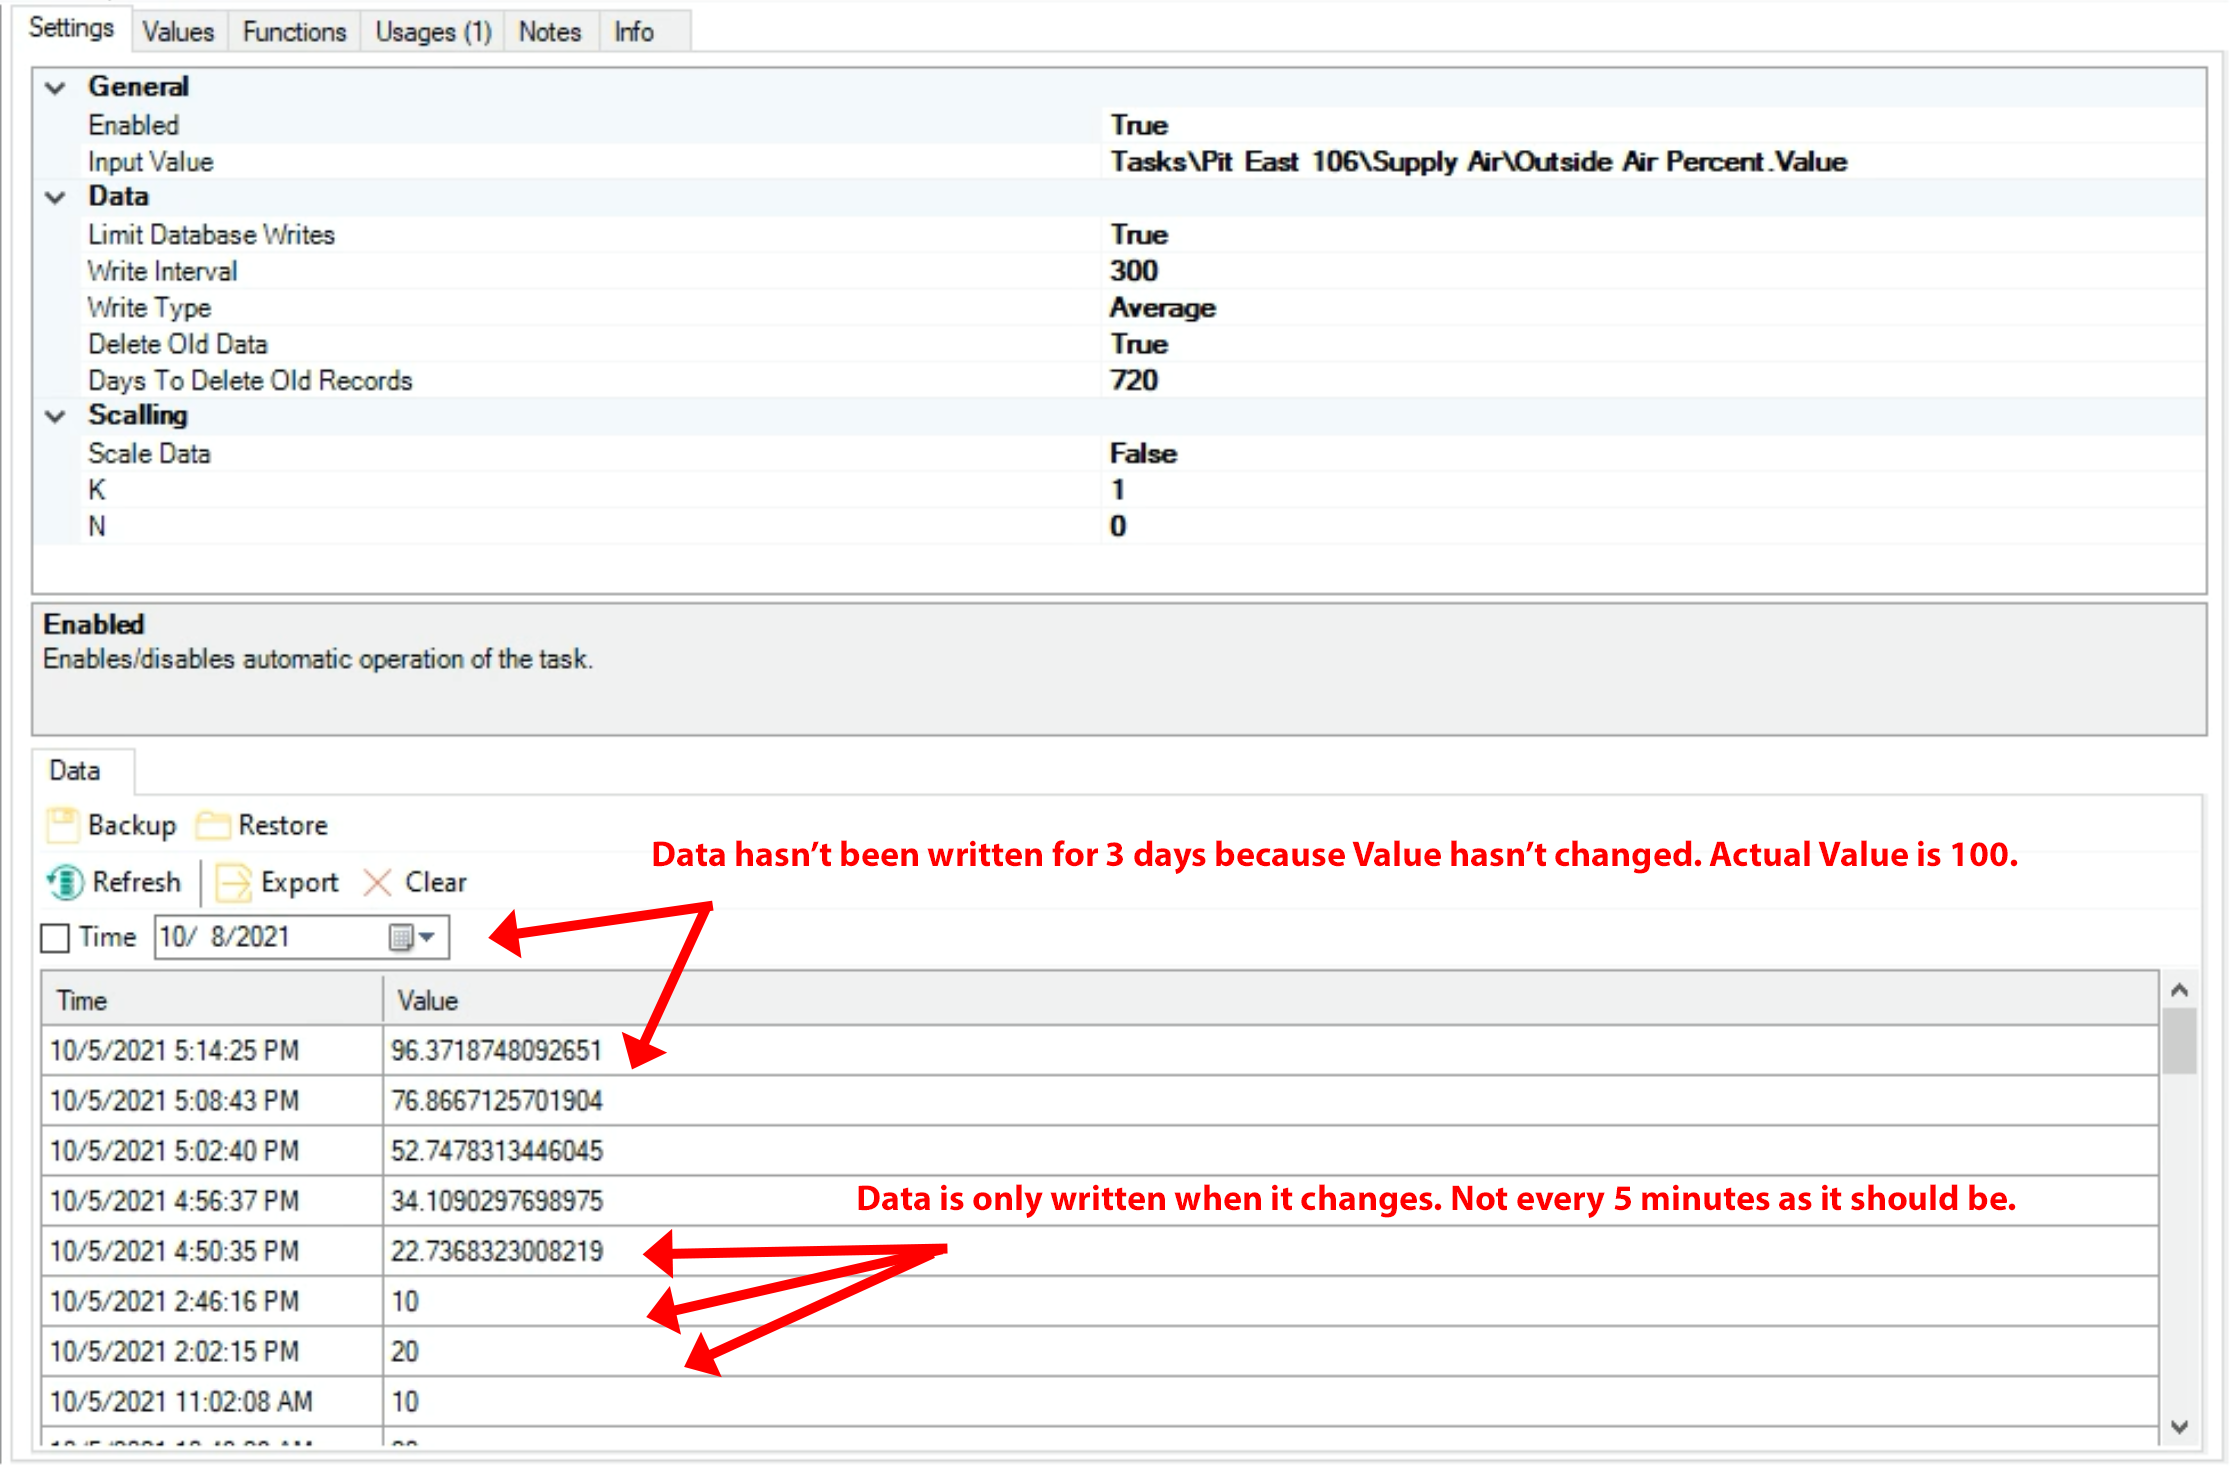
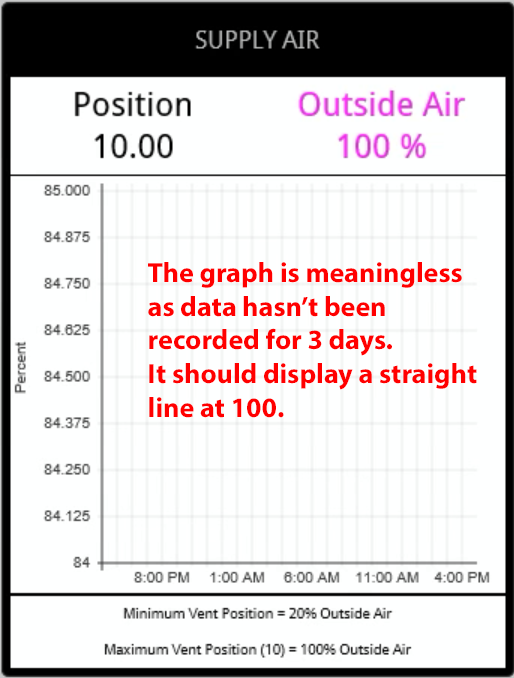
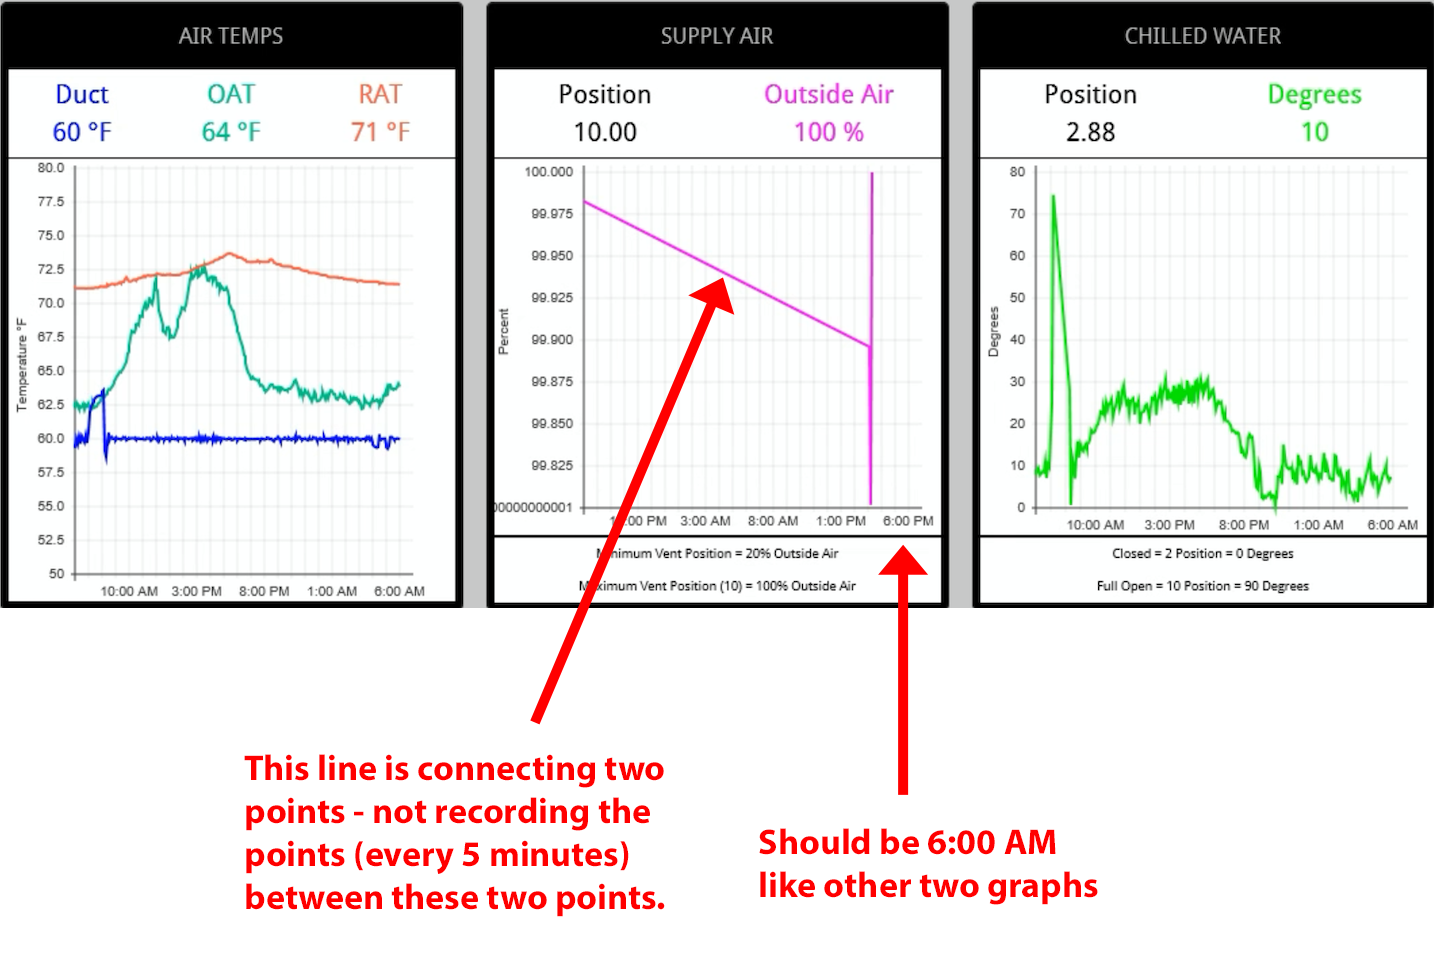
I am graphing an Analog Log in which the Input Values often hold steady long period of time. When this happens the data is not recorded and there is no visual indication of the graph value. When the value does finally change, a diagonal line connects the last recorded point and the new point - rather than displaying a straight line when the data value was constant.
I am attaching screenshots to try and explain this.
Customer support service by UserEcho

Hello,
our Analog log automatically saves the value if the value is sent to bOS. If the value is not sent to bOS then the Analog log saves nothing, this is also safety feature if device is sending values. Since the device is not sending any values the log is then empty. If you want to see value in log, we can recommend enabling the cyclical read.
Best regards
CyclicalRead is enabled. Device is BACnet.
I'm guessing there is logic to check if the new value equals the current value. If so, the new value is not saved. This makes sense so you are not flooded with data. But it doesn't take into account conditions like mine where the value may not change for a long time (hours, even days). In this case the data needs to be saved at regular intervals. In the scenario I outlined above, every 300 seconds as selected for "Limit Database Writes."
I tested "Limit Database Writes" as FALSE also and the same problem existed.
Hello,
could you please send us backup of your configuration to our email ( support@comfortclick.com ) with the proper login so we can check where is the issue.
Best regards
Hello,
I have same problems as Bert describes. Also I have systems where unchanged value get written but then graph view is showing "nA" value left bottom corner and no graph line until I change view from day to month and I get line and values to y-axes. So there may be different reasons not getting good graphs.
Not a solution but more logical graph comes when I change "Step Plot" -> "True" at "Data loggers" window. So I get horisontal long line between long gaps with no data and not diagonals.
Best regards
Hello,
is there anything new about this topic? I am having the same problem with graphs.
Thanks.