
0
Under review
Graph problem
Hi,
Something weird is happening with the graphs.
I have 8 HVAC zones with an analog log for set temperatura and another one for room temperature each. Well, I've added to the visualization a data logger (opengraph button) for every zone and added to it the 2 analog logs.
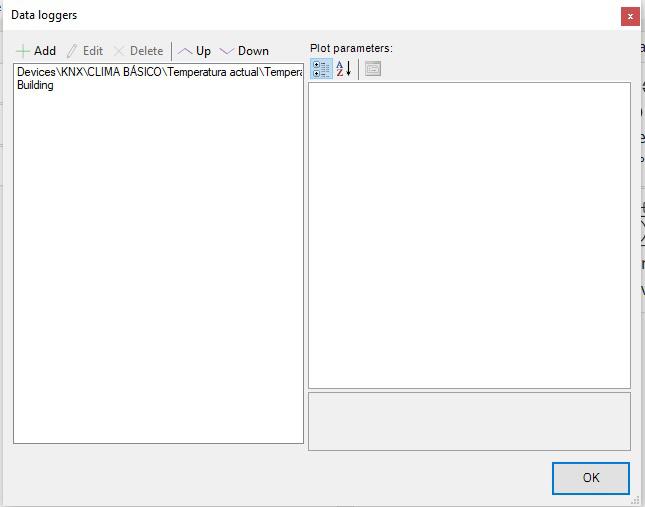
Everything was fine with the first 6 zones. 7th and 8th zones only work fine if I add to the graph only one log. If i add a second log to it, a error shows when I try to open the graph in the visualization. Then I open the graph in the config and one of the two logs is missing, showing the first one and another one with the "Building" node (see image attached).
Is this only happening to me?
Thanks in advance.
Best regards,
Customer support service by UserEcho

Hello,
try updating to the latest BETA version where this problem has already been fixed.
Best regards.
Hi,
Thanks for the reply. There is no beta version available to download yet. Server has version 4.6.24.
I'll update the server as soon as it's available.
Best regards,
Hello,
did you select update and switch the tab from release to beta?
Best regards.
Hello,
Yes, I tried that, but no beta update is available:
The server version is 4.6.24 and is connected to the internet (I'm using the server writing this right now).
Best regards,
Hello,
I've updated the server to the latest beta version (4.6.26) but the problem is not solved yet.
Best regards.
Hello,
this problem should be fixed and graphs should work normally. Can you try and create a brand new graph and try to use another new graph as the second value?
Best regards,
I know what the problem was. Instead of adding a new graph, I copied and pasted from another one and then, when editing the values, the error showed up. In earlier versions this didn't happen.
Adding new graphs and editing all the values works fine now.
Thank you very much.
Best regards,