- ComfortClick
- General
-
 Questions

0
Analog Graph - Scalling question
Hello,
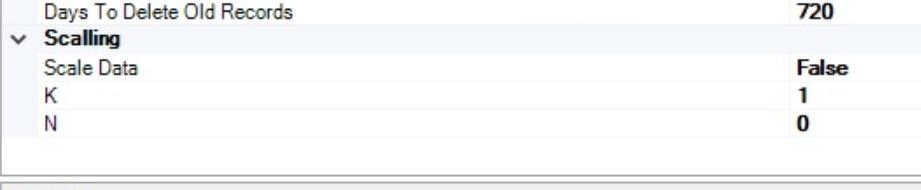
In analog graphs, it is possible to scale data.
Since I have never needed to do this, I haven't looked into the details until now, but while trying to improve my setup, I discovered that it could be useful. However, I don't understand and (despite my research) haven't been able to figure out what the two options “K” and “N” mean and how to use them...
Anyone to bring me some light ?
Thanks,
Customer support service by UserEcho

I haven't needed it either yet. And the manual is somewhat unclear what these K and N values actually do or how to calculate them. Here is a little explanation.
In the equation Y = KX + N, K is the slope or rate of change (how much Y changes for each unit increase in X), and N is the Y-intercept or the vertical shift (the value of Y when X is zero). Together, K and N determine the specific linear relationship between the variables X and Y, with K dictating the steepness of the line and N controlling its vertical position on a graph. Understanding K (Slope/Rate of Change)
Understanding N (Y-intercept/Vertical Shift)
Example
Temperature probe: Analog Log-scale.bos
Raw: 0 – 1023 counts ↔ scale to: 0 – 100 °C
K = (100 – 0) / (1023 – 0) = 0.0977 (°C per raw count)
N = 0 – 0.0977 × 0 = 0
So if your sensor is sending out values temperature values as0-1023 then the analog log will scale its value to 0-100 range.
If instead the sensor is 0.1 V → 0 °C, 0.4 V → 100 °C, and the PLC turns 0.1 V into 512 counts, 0.4 V into 2048 counts:
K = (100 – 0) / (2048 – 512) = 0.0769
N = 0 – 0.0769 × 512 = –39.4 (≈ –39)
Thanks a lot Jürgen, very useful !
Not obvious at all I must say... It would have been really helpful to find something in the doc. At least there is something really understandable here now.
I have a silly question: In analog graphs, it is possible to scale data.Since I have never needed to do this, I haven't looked into To answer a scaling question for an analog monkey type graph, you need to identify the minimum and maximum values of the data you want to plot and choose a suitable scale for each axis that fits the graph paper's dimensions, ensures clear visibility, and clearly labels the units. The chosen scale should make the most relevant parts of the data visible and allow for easy comparison by using consistent increments My values seem to be a little off. My Fluke meters are usually showing around 35A on L2 and L3 while my controller is showing 39A.