- ComfortClick
- bOS Client
-
 Questions

0
Under review
Grpah scale padded
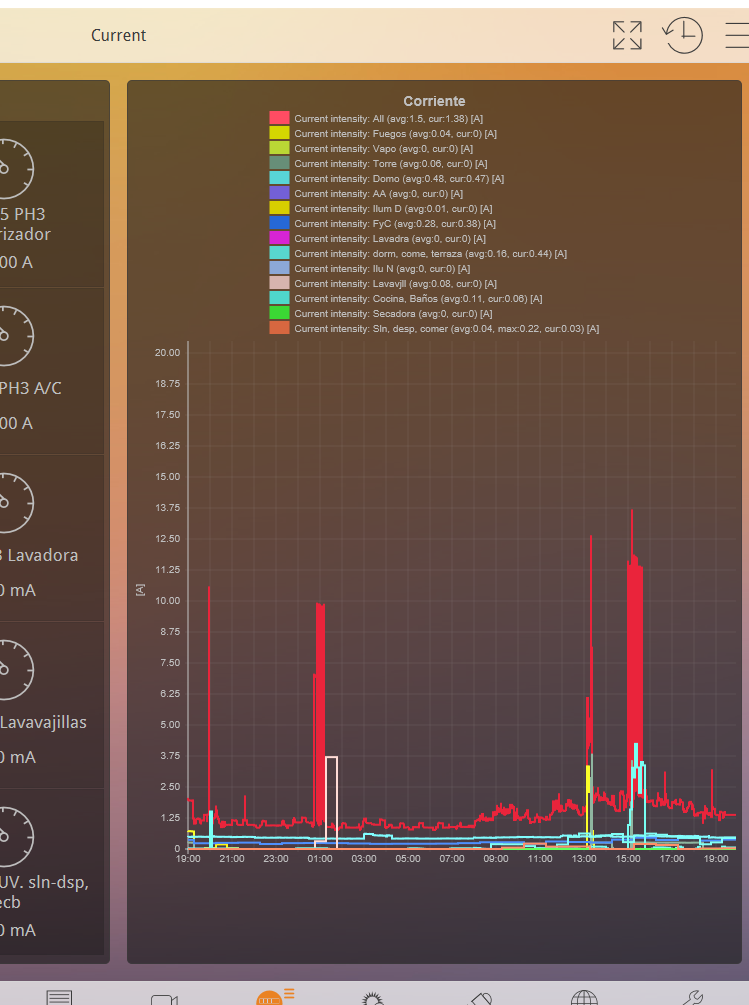
Anyone knows why the graph scales more than required? For example in the image attached, the maximum value achieved on the Y axis for the current is about 13 A, however BOS chooses to scale the graph with a maximum of 20 on the Y axis.
Tbh, even is the number on the Y axis was 5, the graph would still show 20 as the max, hence losing all ability to read the values.
Any thoughts? there is no way to change any property to create such padding space!
Customer support service by UserEcho

Anyone has any thoughts? @Comfortclick team? I have not been able to find any parameter to set the above up, and yet the graph scales and creates unnecessary padding
Hello,
value 20 was probably a max value at a certain time and bOS saved that max value and uses it as a top value of the graph. That's how it's currently working. It may be improved by using the top value as current max value of the displayed graph, but haven't received this request yet.
Best regards.
Thanks guys, however, there must be something else here, for example when the max value shown in graph (red line) is 3.5 for the period the graph covers (e.g. 24 hours), it is a real time graph, then BOS scales it properly, ignoring that supposed max value of 20.
Regarding your recommendation, not sure whether the graph allows, setting a max value, I cannot find such a thing in the graph properties. See below please the controller behind the graph
Hello,
could please send us back up to our support email: support@comfortclick.com
Select log and click on Backup button.
Best regards