Counter log visualization
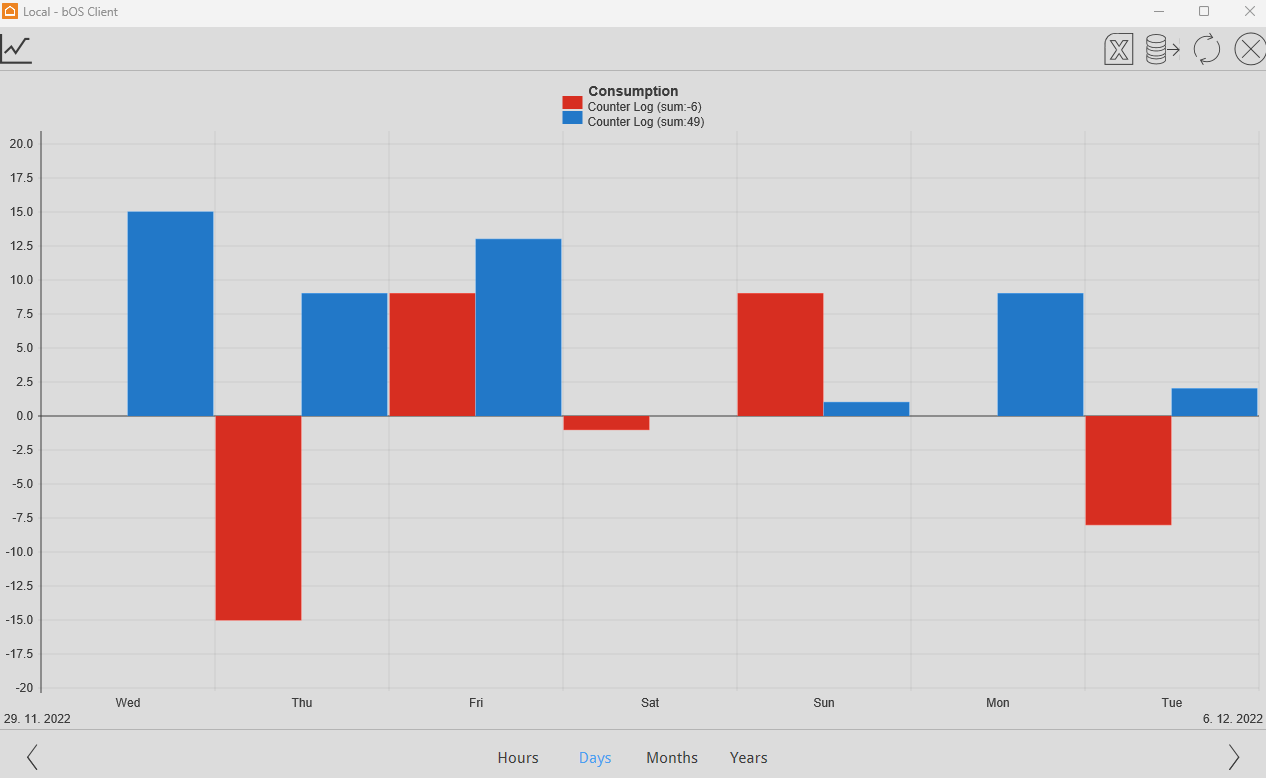
Once everything is set in the Configurator, the client can select the log in the visualization to have a full overview of the data logged.
Using the bottom menu, the client can switch between hours, days, months and years view.
The top right buttons will allow us to extract the data and save it on any PC.
The first button will export the data as a .cvs file and it can be opened in Microsoft Excell and analyzed.
The second button will export the data as a .db file and it can be opened with any SQLdata reader analyzed.
Customer support service by UserEcho
