Multiple data logs in one
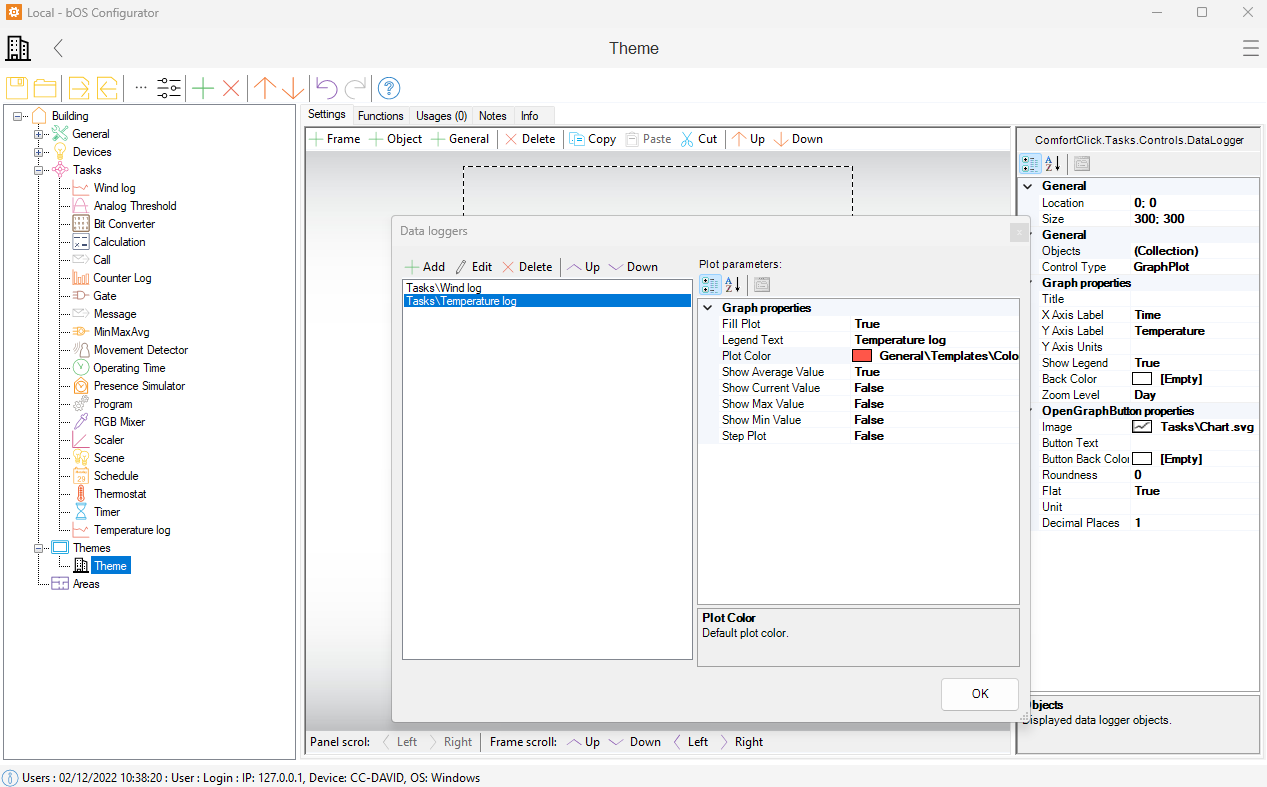
By selecting the log in the visualization and selecting the (Collection) function, we can add more logs and display them in one log in the visualization.
Each log can be selected from the list and tweaked individually. Legend text can be changed, plot colour and what kind of data is displayed.
Customer support service by UserEcho
